Discover your intellectual strengths
Your IQ score is 111.
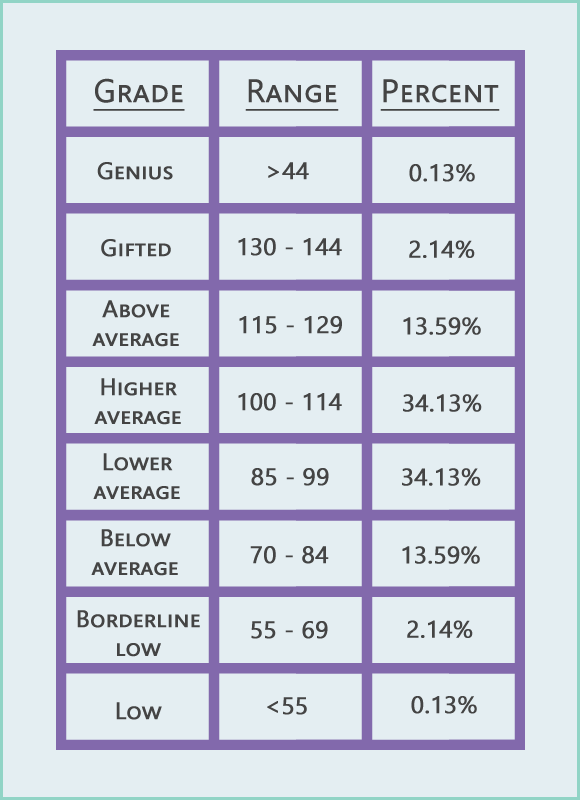
Score range: Higher average.
Your performance on the test lies within the population average, and you possess a potent mix of skills and insight.
You are able to think critically and communicate effectively and have the ability to handle most academic challenges. If you think of intelligence as the ability to adapt quickly to new situations, then you are heading in the right direction. Adding to your knowledge can only help to broaden your horizons and uncover your full potential. The correct answers section of this report identifies the skills examined for each question. You will benefit by becoming more aware of your abilities and understanding your strengths and weaknesses. Visit the IQ Test Labs practice section to hone your skills for all cognitive abilities!
The average IQ score is 100, and you scored higher than 76% of all test takers.
Questions answered correctly: 23
Questions answered incorrectly: 7
Left blank: 0
The IQ Test Labs scale is equivalent to the Wechsler scale. (mean=100 and standard deviation=15)
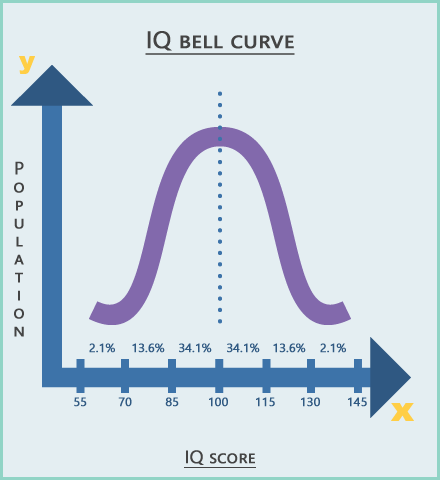
The bell curve (also called a "normal curve" or "normal distribution") is a graph that shows approximately how much of the population falls into each IQ range. In theory, if we tested everyone in the world with a traditional IQ test, most people would score in the " Average" range. A smaller number would score moderately below average and moderately above average. Very high and very low scores are rare.
The scores and percentiles above apply to tests that have a standard deviation of 15 points. The Stanford Binet Fourth Edition (Binet FE) has a standard deviation of 16 and the Wechsler scales (such as the WPPSI-R, the WISC-III, and the WAIS-III) have a standard deviation of 15. Therefore, for different scales the percentages may vary.
Click here to convert your score to the Cattell and Stanford-Binet scale.
1. Desert is to oasis as ocean is to:
A. Water, B. Sand, C. Sea, D. Island
Answer: Desert is to oasis as ocean is to island.
Explanation: Analogy: Part to whole.
Cognitive abilities: Verbal abilities, classification skills.
2. Which number follows? 2, 4, 9, 16, 25,
A. 27, B. 34, C. 36, D. 45
Answer: 2, 4, 9, 16, 25, 36.
Explanation: Sequence of squares. (1*1), (2*2) ... (6*6).
Cognitive abilities: Mathematics skills, logical reasoning.
3. Choose the conclusion that validly follows from the argument:
All kittens are playful, Some pets are kittens, Therefore:
A. All kittens are pets, B. Some kittens are pets, C. All pets are playful, D. Some pets are playful
Answer: All kittens are playful, some pets are kittens, therefore some pets are playful.
Explanation: Deductive reasoning: reasoning from one or more premises in order to reach a logical conclusion.
Cognitive abilities: Logical reasoning.
4. Which shape results after folding along the dotted lines?

Cognitive abilities: Visualization skills.
5. You are building an open-ended (straight) fence by stringing wire between posts 25 meters apart. If the fence is 100 meters long how many posts should you use?
A.2, B.3, C.4, D.5
Answer: Five posts are needed
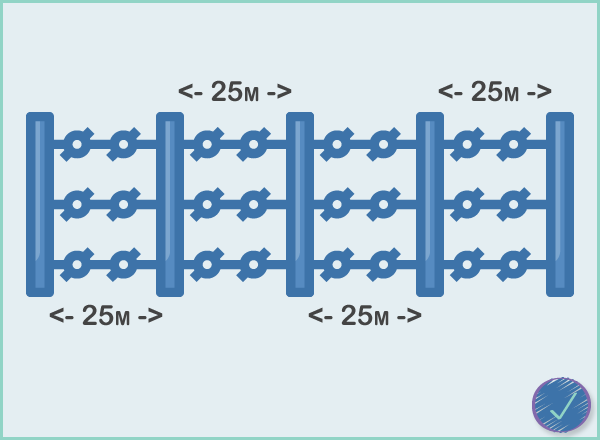
Explanation: There are four intervals, each 25 meters long, for a total of 100 meters.
Cognitive abilities: Mathematics, spatial orientation.
Correct answers continue. The test has 30 questions.
Used in its broadest sense, intelligence is what people use to learn, remember, solve problems and in general deal effectively with the world around them.
More definitions from researchers include:
- General adaptability to new problems in life.
- The ability to engage in abstract thinking.
- Capacity for knowledge and knowledge possessed.
- The ability to judge, understand and reason.
Francis Galton was among the first to measure individual differences in intellectual abilities; his work was followed in 1905 by that of French psychologist Alfred Binet, who introduced the concept of mental age, which would match chronological age in children of average ability. In modern times, the dominant method of studying intelligence in this century has been the psychometric approach, where the average score is arbitrarily defines as 100.
Whatever the nature of the IQ test, many researchers believe that a general statistical factor can be extracted from the results of multiple IQ tests mainly due to the fact that people who perform well on one type of intelligence test tend to do well on others also. Charles Spearman named the general mental ability that carried over from one test to another "g" for general intelligence, and decided that it consisted mainly of the ability to infer relationships based on one's experiences.
In the 1960s American psychologists Raymond Cattell and John Horn applied new methods of factor analysis and concluded there are two kinds of general intelligence: fluid intelligence (gf) and crystallized intelligence (gc).
Another approach is Howard Gardner's theory of multiple intelligences, which replaces the general intelligence factor (g ) with seven different types of intelligence: linguistic; logical-mathematical; spatial; interpersonal (ability to deal with other people); intrapersonal (insight into oneself); musical; and bodily-kinesthetic (athletic ability).
The statistics gathered from this test reveal the following interesting facts.
- Those with higher education outscored everyone else.
- Those with jobs in technical or professional fields or who hold positions in senior management came out as clear winners in the IQ stakes. At the bottom of the list are the unemployed.
- New Zealand is the brainiest of the bunch. Neighbors Australia follows and then come Ireland, the U.K the U.S.A and Canada.
- Brown haired men scored higher than their blonde and red haired counterparts. Black haired men scored significantly lower than everyone else.
- As with men black haired women scored below the rest.
- People who have a political inclination toward the center or who vote greens scored highest with right wing voters not far behind. The socialists scored at the population average of 100 while those who chose communist and 'other' came last.
More statistics are displayed graphically in the charts section